6.30.2007

rent control redux


"High transaction costs, rent control linked to RP slums"

So goes the headline of this Inquirer article (archive copy) reporting the research findings of the Global Property Guide. Which pretty much confirms the points I made about how our intractable rent control law is to blame for the size of our squatter communities.

This from the article (emphasis mine):
The Philippines is the only country -- other than Taiwan -- in East Asia with a rent control law. Rent control and high transaction costs tend to discourage property owners from participating in the market, leading to lower supply.

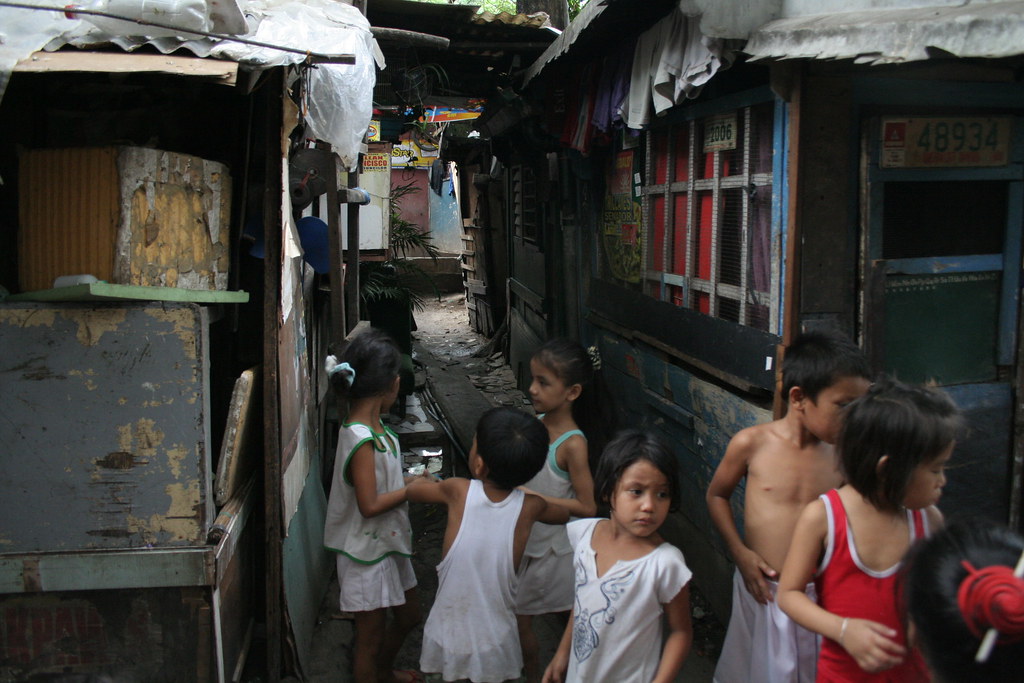
If households cannot buy or rent housing due to prohibitive costs and lack of options, they may turn to self-built houses, or worse, illegally built houses on lots owned by other entities (squatting).

The GPG report itself highlights the high real estate transaction costs in the Philippines ("roundtrip" transaction costs can take up to 35% of the total property value) - and GPG reports the process of registering property in Metro Manila as "the most cumbersome in Asia."
There are eight procedures in registering property...

“In addition, payments must be made to three different offices: the Register of Deeds for the registration fee, the BIR for all the taxes and the City or Municipal Treasurer’s Office for the transfer tax. With each office and payment, there is always room for corruption and extortion.”
The report makes the following recommendations to reduce transaction costs:
  • The establishment of a one-stop-shop for property registration and payment of taxes;
  • Centralization of property valuation records held by the BIR, city and municipal treasurer’s offices, banks, Register of Deeds and other agencies;
  • Establishment of a standard property valuation system;
  • Creation of a website for all the necessary data for the real estate market; and abolition of the rent control law (the government should instead provide a standard contract for rental agreements).
Doubtless this will help people who want to buy and sell property but to expand the rental market and provide better housing options for the poor, we have to touch that third rail and find a path to gradually but definitively eliminating rent control. This is the only way to create a large scale, market-led response to creating better housing for the poor.

In my post last year, I focused on why eliminating rent control should be high on the Heritage Conservation Society's strategic goals:
Now why should this be important to the Heritage Conservation Society? Because the only real way to preserve our built environment is to make sure it is in the economic interest of the owners to invest in their properties. The Society may save a building or two by their current media strategy but they will do an even greater service to Metro Manila's heritage by making sure it is financially rewarding for landowners to reinvest in old buildings. Otherwise, the lack of actual income from rent causes disinvestment and decay. Landowners who can source new capital will more likely tear down their old buildings, while those who do not have the resources will not even be able to re-finance enough so that they can invest in the upkeep of their old buildings.
As to the effects of lifting rent control on the poor, I had this to say:
Now what about the poor? Won't lifting rent control make it more difficult for the majority of our population to find housing? We've had rent control for over 5 decades. As Dr. Phil likes to ask, "How's that working for you?"

Multiple Choice Quiz: We add over 100,000 people to the population of Metro Manila each year. And because we build so few new apartments, where do you think most of our new internal migrants wind up living?

a) In dilapidated housing
b) In crumbling apartment blocks
c) In old, over crowded boarding rooms
d) In squatter colonies
e) All of the above
(Take the time to read through the extensive and thoughtful comments to that post.)


Image credit: 960618-Payatas-22
by KarlMarx

6.26.2007

it has begun

Senor Enrique reports that Lim has started to demolish the pedestrian mall.


No consultations. No review. Just sledgehammers.

No defenders either.

At this rate, Manila Zoo is also probably doomed. And the Baywalk should also be nervous.

Sigh. Short-sightedness, lack of vision wins again.

We really, really need 1,000 Friends of Metro Manila.


Image credit: Senor Enrique
Wish you were here

6.23.2007

to do list: item #1 "the big draw"


Starting with this post, I will begin a wish list of activities that I'll try to start in Metro Manila when my journey to Ithaka finally hits the return bend. Item #1 on my list was inspired by attending the opening day of the David Macaulay exhibit ("The Art of Drawing Architecture") at the National Building Museum here in D.C.

The opening day featured the very first Big Draw event in the U.S. -an echo of the various events that the Campaign for Drawing holds in the U.K.

I'd like to start a similar campaign back home. Here's what the Campaign's website says:

Welcome to the Campaign with a simple aim: to get everyone drawing. The Big Draw, the Campaign's annual October showpiece, proves that drawing can be a public activity as well as a private passion. 1000 venues across the UK, from great national institutions to village halls, regularly join in to offer people of all ages the chance to discover that drawing is enjoyable, liberating and at everyone's fingertips.

The Campaign was inspired by the great Victorian writer and visionary, John Ruskin. His mission was not to teach people to draw, but how to see. Each Big Draw season brings fresh opportunities to discover how drawing can connect us to our environment and heritage.


And there's the phrase that caught my fancy: "His mission was not to teach people to draw, but how to see." Also: "how drawing can connect us to our environment and heritage."

What a great way to get people aware of their city. Maybe I can get the wonderful folks from Illustrador ng Kabataan to help.

Image credit: Logo of the Campaign for Drawing
by Quentin Blake


P.S. - Blake and Macaulay, along with Chris Van Allsburg, are my favorite illustrators.

P.P.S. -If this post inspires you, you're very welcome to run with the idea. If I was back home now, I'd organize a big draw event in the pedestrian mall in Avenida. Maybe a crowd of children drawing will convince Lim to keep the street.

6.15.2007

megacities by the numbers


IEEE's* Spectrum Online's June 2007 edition is a special report on megacities, including an article on Megacities by the Numbers from which the above graph is culled.

The graph shows the GDP (PPP) of the 20 largest megacities in 2005 and their projected GDP in 2030.

Going by the graph, our megacity's economy currently rides the same pack as Rio de Janeiro, Shanghai, Istanbul and Mumbai (at about $100 billion); and is ahead of Beijing, Cairo, Jakarta, Kolkata (Calcutta) and Delhi.

Metro Manila alone accounts for more than a fifth of the national income -and taken by itself, our megacity's economy would rank 60th among the world economies -just behind New Zealand and ahead of Sri Lanka. (The country currently ranks 24th or 25th.)

By 2030, with the exception of Shanghai which will race ahead, our economy will keep company with the same pack of cities (at about $250 billion).

The special report ("A How-To Manual for Megacities") is a must read for students of urban development, and includes:


And for simcity fans, a feature on the man who came up with Arcologies.

And, since the Spectrum is an engineering journal, the special report also highlights Shanghai's plans for a new green city (Dongtan); Sao Paolo's complex transportation system; Mumbai's power generation and distribution system; Tokyo's earthquake management system; and, New York City's hi-tech crime monitoring center.


*Institute of Electrical and Electronics Engineers
All GDP figures in PPP

6.13.2007

democratic open spaces


A presentation on EDAW's landscape architecture for the Tokyo Midtown project. An inspiring project in a city hard pressed for public green. Half of the ten twenty-five-acre site is dedicated to public open space, including parks, plazas, promenades, and streetscapes.

The primary developer is Mitsui Fudosan, working in concert with several partners. The project was designed by architectural firms Nikken Sekkei and Skidmore, Owings & Merrill, with landscape architecture of the surrounding new 4-hectare (10-acre) public park designed by EDAW, the Suntory Museum of Art designed by Kengo Kuma, and the design of the retail Galleria handled by the Colorado-based CommArts. (from the wikipedia entry.)
Click on the image to begin the flash presentation (with audio).

(Via the Urban Land Institute's Ground Floor blog.)

lakbayan


I got a C- in Lakbayan (by Eugene Villar).
How much of the Philippines have you visited?

UPDATE:

Eugene changed the scoring system and so I got
bumped up to a C+! So I just left the "almost failed" column.
Thanks, Eugene!


Judging by the google hits and the comments on the
post -this has got to be the pinoy blog meme of the year!


6.11.2007

gusse: where cities meet cities


Global Urban Sustainability Solutions Exchange.


Now imagine an Amazon-like online destination where the ‘products’ are sustainability solutions and the conversations of countless consumers, like you, continuously identify the best solutions – all of which are free!

The world has never had an opportunity to share and build the sustainability knowledge already within our cities. GUSSE is an innovative online website that brings together the most current, valuable and trusted solutions for urban sustainability, then refines and applies them within a ‘social networking’ framework that harnesses collective wisdom on a global scale.
Governance Vision

GUSSE’s only purpose is to serve the needs of urban professionals. An independent governance body is being convened to champion this purpose on a global stage, and to actively curate and provide high-level credibility to the assembled solutions. This body will consist of senior representatives of leading cities, countries, NGOs and corporations, along with thought leaders from professional organizations, institutions and civil society. Core governing principles derive naturally from GUSSE’s social networking architecture:
  • Open - inclusive, transparent, collective, shared
  • Practical - easy, accessible, action-oriented, user-friendly
  • Reliable - current, high-quality, high-integrity, trustworthy
  • Independent - agenda-free, non-patronizing, non-authoritative
  • Nimble - adaptive; responsive, emergent.

6.10.2007

what to consider


Further on the UBC analysis of land use and transportation issues in Naga City, as reported by Wily Priles, I list down a few dimensions of analysis that I think Naga should consider as they move forward. (They were not expressed in any of the UBC slides but I have no idea if they were considered in the discussion.)

When thinking about land use and transportation, Naga city planners should ask the following (and I list them down in no particular order):

Land Use:

  • What does the current land use map look like?
  • What does the future land use map (based on the new comprehensive plan) look like? (Btw, I was a little disappointed that the UBC didn't tap Naga's extensive GIS datasets for their analysis. Perhaps they didn't have time or the GIS chops.)
  • Where are the areas of transition?
  • What is the current per capita land consumption?
  • What is the projected future per capita land consumption? -and will this be sustainable?
  • Where are the environmentally sensitive areas? What measures are in the plan/policies/codes to protect these areas?
  • How large is the local watershed? What are the key streams and tributaries and where do they enter and exit the city?
  • How healthy is the local river network?
  • What measures are in place to protect the watershed and the river network?
  • Where are the most fertile agricultural soils? Are they protected under the new comprehensive plan?
  • Which agricultural lands are most threatened by development? Should these lands be preserved and protected?
  • What is the land ownership structure?
  • Who are the biggest land owners?
  • What is the ratio between the total land area owned by the largest land owners and the total area owned by small landowners? (The breakpoints will need to be defined.)
Demographics and Economics:
  • What are the current residential densities?
  • What are the densest areas? The least dense?
  • What are the fastest growing areas (in terms of residents)?
  • Where do we want growth to go? How can we direct growth to go there?
  • How can we direct growth away from environmentally sensitive areas and valuable agricultural land?
  • What does the age distribution of the population look like now? What will it look like in the future?
  • Where do people work? Where are the job centers?
  • If people work outside the city, where do they go to find jobs?
  • What are the fastest growing jobs?
  • What is the most popular industry for the self-employed (e.g. -street vendors or pedicab operators)? Where to the self-employed conduct their business? Whom do they serve?
  • What are the incubators for small business? Where are these located?
  • What is the ratio of self-employed to the employed?
  • What is the ratio of people who work in the city vs. those who work outside the city?
  • If people come from outside the city to work in the city -where do they come from?
  • What is the median income of people who work in the city? And the median income of those who work outside the city?
  • On average, how far do people have to travel to get to their place of work? How long does it take them to get there?
  • How long (in years) does a worker in the city, earning the median income, have to save to buy an average priced house (downpayment and mortgage approval) in the city?
  • What is the ratio of renters to owners? Are the number of renters increasing or decreasing (annually)?
  • How many rental units are available? What is the average rental size?
  • Where are the renters concentrated? What is their profile? (age, status, etc.)
  • What is the average rent?
  • What is the rent backlog and how many rental units are produced every year? Is it increasing or decreasing?
Transportation Networks:
  • What are the main transportation modes? (Private car, public buses, taxis, jeeps, tricycles, pedicabs, etc.)
  • How many people use each mode? Which modes are growing in use? declining in use?
  • What is the average distance traveled by each mode?
  • What are the main transportation corridors?
  • Which modes share these corridors? What modes were these corridors designed for?
  • What are the corridors connecting (on a local, regional and national level)?
  • What are the distances between these nodes?
  • What are most heavily used corridors in terms of vehicle count?
  • What are most heavily used corridors in terms of people count?
  • What is the peak and average travel times in these corridors?
  • Which nodes have the strongest connections (vehicle and people) and which have the weakest?
  • What do the travel sheds from each node look like for each mode? (i.e. map the average distance traveled of each mode from each node.)
  • What are the secondary travel corridors -and which modes use these the most?
  • Where are the heaviest pedestrian corridors? How do they interact with the vehicle corridors?
  • What is the average pedestrian walk?
  • How many modes do most people (non-private car users), on average, use to get to their destination?
  • In what nodes and corridors do the most accidents occur? What modes are involved?
  • What is the average vehicle speed for each mode in these corridors?
  • Where do accidents that involve pedestrians occur most? What mode is most involved?
  • Where do pedestrian fatalities occur the most? What time of the day do most accidents happen? What is the average vehicular speed (traveling and turning) in these locations?

Land use and transportation planning is all about figuring out relationships and all this data should be layered on maps to answer the following questions:
  • What can you learn from overlaying the travel sheds, the land use maps, the accident locations and the corridors and nodes?
  • What is the interaction between the transportation network and growth? Future growth?
  • What can you infer when you map job centers, rent, incomes and growth?
  • What are the fasting growing employers? How much land is devoted to these job centers?
  • What are the most stable sources of income? How much land is devoted to these industries?
  • How do the transportation networks connect the fast growth job centers and the stable industries to the high rent/high ownership areas?
  • What modes, nodes and corridors do we want to encourage? What do we want to discourage? How is this informed by our land use plan?
  • How is the current land use interacting with the current transportation network?
  • How will the future land use interact with the future transportation network?
This is by no means exhaustive but all this data is just fact finding, and should be used as a framework to a community visioning process.

P.S. - If I was with the UBC team, I would have tried to map all the areas and routes served by pedicabs vs. the areas that are walkable. I'm certain that map would have been very illuminating.


Image credit: Bicolandia 035
from kool.angot's* flickr photostream


(*-hehehe)

philipines = oklahoma


So says Map 131 from Strange Maps. The map renames the US states with the names of countries with the same GDP.

Yes, Oklahoma. (It's the state shaped like a cleaver, right above Texas.) Home of infamous global-climate-change-denier, Sen. James Mountain Inhofe. (How backward is that? And he's been in office since 1994!)

Of course, as Strange Maps rightly points out, the GDP equivalents don't account for populations:

The creator of this map has had the interesting idea to break down that gigantic US GDP into the GDPs of individual states, and compare those to other countries’ GDP. What follows, is this slightly misleading map – misleading, because the economies both of the US states and of the countries they are compared with are not weighted for their respective populations.

Pakistan, for example, has a GDP that’s slightly higher than Israel’s – but Pakistan has a population of about 170 million, while Israel is only 7 million people strong. The US states those economies are compared with (Arkansas and Oregon, respectively) are much closer to each other in population: 2,7 million and 3,4 million.

And yet, wile a per capita GDP might give a good indication of the average wealth of citizens, a ranking of the economies on this map does serve two interesting purposes: it shows the size of US states’ economies relative to each other (California is the biggest, Wyoming the smallest), and it links those sizes with foreign economies (which are therefore also ranked: Mexico’s and Russia’s economies are about equal size, Ireland’s is twice as big as New Zealand’s).
So, here's the tale of the tape:


OklahomaPhilippines
Area181,196 km²298,170 km²
Population3,450,65488,706,300
Density30.5/km²276 /km²
Largest MSAOklahoma CityMetro Manila
Pop. of largest MSA1,225,08411,289,368
GDP Per Capita$ 34,286$5,000 (PPP)


The original map, i think, is from Carl Stormer's blog ("Carl Talk"), and came to Strange Maps via The Big Picture.

Strange Maps is currently one of my favorite blogs. It pleases my map geek heart.

6.08.2007

forward thinking in naga city

Take time to read through Willy Priles' recent posts about the University of British Columbia (SCARP) urban planning research studio presentations in Naga City. The students were led by Dr. Leonora Angeles whose areas of specialty include (very aptly) participatory planning and governance and gender and international development.

I also did travelling studio classes when I was in grad school are they are win-win propositions all around. The students get hands-on, on the ground experience as well as exposure to different cities and cultures, while the host (and subject) cities get innovative ideas unvarnished by local political expediencies.

My favorite studio was in Wuhan, China under (then Dean) Peter Rowe. We considered and came up with proposals for the Wuhan master plan, in general, and the redevelopment along the Han River waterfront, in particular.

But I digress.

Of particular interest to me were the UBC team presentations on urban design and placemaking for the Naga CBD, and the presentation on land use and urban planning (subjects near and dear to my own heart).

Was pleased to see Curitiba and Surabaya cited as examples in the land use and transpo presentations. And was even more pleased that the discussion centered around smart growth.

Of course, I have my biases. It would be fantastic if Naga, which already leads the country in participative governance, could also lead the country in smart growth, a.k.a. -sustainable urban development.

Vancouver (in B.C.) also happens to be one of the leading lights in smart growth. (For people interested to learn more about smart growth, here are the 10 Principles, or you can download this pdf (140kb) that explains what it's all about.)

The UBC team also highlighted demand-led transportation strategies (i.e. -providing alternatives to car use, vs. the supply method of building more capacity to accomodate more cars) and discussed induced demand, something our own transportation and urban planners really need to hear.

The major component of the land use presentation was a proposal to create greenways throught the Naga CBD and out to the key nodes in the city. (See image.) And Willy reports that it had considerable reactions (both pro and con).

I think Naga should seriously consider greenways -but that these should be reshaped into pedestrian and bike and pedicab routes (hmm, expressways for the pedicabs?). They should also consider modelling the CBD segment of the greenway after Barcelona's La Rambla, which is more of a linear pedestrian mall and market. That way, they don't have to try to aggregate the street vendors into the existing public markets. (Trying to get street vendors into public markets has been tried and has failed countless times in countless cities. Witness the continuing battle for street space in Baclaran.)

I hope the biggest message Naga's leaders get from the UBC presentations is that participatory governance, charting the city's future, should also include envisioning the future physical and geographic configuration of their built environment. After all, people don't live in policies -but live in the physical consequences of those policies.

6.06.2007

anak ng pasig


And you thought the Pasig River was polluted. Maybe Jakarta can learn some lessons from us.

Check out the Richard Shear's report on the Citarum River in the Daily Mail.

two steps back


Oh for heaven's sake:


Mayor-elect Alfredo Lim has promised to reopen the closed portion of Rizal Avenue when he assumes office next month.
And where do these clowns come off suing Atienza to re-open the road to vehicular traffic "in (sic) behalf of ManileƱos?”

Do we need a Pedestrian Rights group? Do we need advocates for Complete Streets?

Where are the lovers of the city? Is this something the Winner Foundation should step into despite their enmity with the immediate past mayor? Parks are about people -and so are pedestrian malls.

Will the merchants of Avenida, who seem to have benefited from the pedestrianization, not speak up?

Ay! Read the last part of this post and learn from Lernier's urban accupuncture.


Image credit: Avenida Rizal, by Senor Enrique.

the wheels on the bus


Futurarc features Jakarta's rapidly expanding and resoundingly successful Bus Rapid Transit system in this article ("Busway Moves: Jakarta’s bus rapid transit system offers hope for the rest of the city’s gridlocked transport" -by Erwin Maulana and Christen Jamar. via Erwin Maluana's blog: Rwien Universe.)

Again, multiple lessons we can learn from a sister megacity where:

Driving speeds averaging less than 15 kilometres an hour during peak times, and average commutes taking well over an hour...(the) city suffers from problems experienced in developing urban centres not only in Asia but worldwide. A combination of urban migration and growing access to cars have created a nasty snarl of traffic as Jakarta’s nearly nine million residents try to get around the city. Bring in the out-of-town commuters, estimated to swell the city’s population on a daily basis by three million people, and you’ve got the makings of an incessant and impenetrable traffic jam.

Among the many unwelcome side effects of such an unsustainable transportation network are a depressed quality of life, lower productivity and, perhaps most importantly, unhealthy air quality.

(c.f. -
Peter's June 5 post "Bleah" on Metroblogging Manila -and the link to the Kate Pedroso's short article in Inquirer. -UDC)

And this analysis by Sutanto Soehodho, chairman of the Jakarta City Transportation Council (DTK-J), an urban transport stakeholder organisation. (Don't we need one of those?)

“Jakarta’s transportation conditions today are approaching crisis level,” says Sutanto Soehodho...(He) says that Jakarta’s main form of public transportation—the city bus system—is currently utilised by only two percent of the population. That is because the buses are over-crowded and uncomfortable; the other form of public transport, a light rail, provides dismal service and an inconvenient network. As a result, most people prefer the solitude and personal space of their cars, even if it means waking up earlier.

There have been regular efforts to expand the road network, but ultimately, transport experts say, energy should be directed at cutting down the number of cars. (Emphasis mine -UDC) According to Sutanto, the length of the road network increases by one percent each year, while vehicle use is climbing 11 percent annually. If they continue at that rate, he says, “Jakarta will totally collapse in traffic” by 2014.

The Jakarta Macro Transportation Scheme, Jakarta's blueprint for transportation (again, don't we need one of those?) includes:

...efforts to limit car usage, such as increasing public parking costs, congestion pricing and enforcing the 3-in-1 system (in high-traffic zones at peak hours, each car must be transporting at least three people). It also includes some road infrastructure improvements, such as widening roads and building flyovers and underpasses. The scheme’s major infrastructure projects include monorail lines and a mass rapid transit (MRT) subway. The government is also looking at the city’s waterways for transport.

..and of course, the TransJakarta Bus Rapid Transit system which...
... has turned out to be an enormous success. It currently carries 100,000 passengers a day, triple the amount it was carrying when it started. Surveys have indicated that 14 percent of Busway riders used to drive; and 80 percent of people asked said they would switch to the Busway system if it was accessible.

Its popularity has led to a rapid expansion—after the first line was launched in 2004, another two started operating in 2005, and yet another four in January of this year. By 2010 the government intends to have 15 corridors in operation, covering a total length of 159 kilometres, according to the DTK-J.

Compare that the the Metro Manila Urban Transportation Integration Project (MMUTRIP) that calls for mainly road expansion and signalization as a solution to traffic congestion. MMUTRIP will cover:

...traffic management improvements of the 3 most heavily used public transport corridors in MM. These are EDSA LRT Line 3 Corridor, LRT Line 2 Corridor and the South Luzon Expressway Corridor. It will also include the improvement of selected secondary roads to better disperse traffic over the road network and reduce congestions in arterial roads. Phase I components of the Project are:

1. On-going construction work for the 2,424 m. secondary road of Pasong Tamo. The civil works will include road, sidewalk and drainage improvements, installation of 3 new traffic signal facilities, 6 waiting sheds, 80 streetlights, 1,688 lm of pedestrian barriers including landscaping works.

2. Construction works for the improvement of EDSA Corridor through the improvement of identified secondary roads and 6 major intersecting roads. It will also involve the construction of new pedestrian bridges, rehabilitation of existing ones, elevated walkways, covered sidewalks and waiting sheds.

3. Finalization of the engineering designs for the improvement of LRT Line 2 Corridor (C.M Rector to Marcos Highway).

In MMDA's world: pedestrian barriers, yes; better bus systems, no. ("But all the important people are in cars...")

Meanwhile, Futurarc lists the sweet reasons for TransJakarta's success:
First, it is an easy and, perhaps more importantly, cheap system to get up and running quickly—the construction required is limited to building shelters and physically separating the bus lane from the rest of vehicle traffic. The shelters are clean; the buses are comfortable and more fuel-efficient. The system has been integrated into the light rail transit (LRT) coming in from the suburbs and with inter-city bus stations in Jakarta’s suburban towns. Plans are in place to integrate the system further with the monorail, subway and water-based transport systems.

And this last line, should be a daily mantra for all our traffic managers and transportation planners.
Sutanto agrees the Busway is the best way of alleviating traffic quickly in Jakarta. “One bus can carry 80 people. Sixty-five cars would be needed to carry the same number of people,” he says.
Ah, but first, we have to get them out of their cars.


Image Credit: Jakarta's Mass Transit System 2015
From Futurarc.com

6.02.2007

curitiba v. bogota


Prof. Randall Crane compares Curitiba and Bogota in the latest post on his Urban Planning Research blog ("Cheap Chatter on Urban Studies"). I don't always agree with Prof. Crane but he does offer very insightful research into urban economics and urban planning. (c.f. this lecture in Toronto on "Sex, Lies and Commuting in the U.S. -1985-2005" -Quicktime. Windows media version here. )

Bogota, he says, "is substantially safer and more pleasant than I imagined, owing apparently to a series of quite visionary and effective mayors over the past decade and a half."

He cites this presentation by Arturo Ardila-GĆ³mez that disputes some of the points made by this NYT article (subscription -but cited in full on Matt Khan's Environmental and Urban Economics blog here) on Jaime Lernier's success in Curitiba. The NYT article contends that Lernier's success was secured during the military dictatorship. According to Crane, Ardila-GĆ³mez contends that, "Lerner was effective mainly because he was a coalition builder, even when the system was not particularly democratic."

Our own mayors should take notes on the need for "visionary and effective mayors" and "coalition builders."

Ardila-GĆ³mez's presentation on the "Institutional Framework of the BRT processes in Curitiba and Bogota" also contains gems for Metro Manila. He compares the similar institutional settings before the BRT systems were put in place in Curitiba and Bogota:

  • Weak government agencies
  • Weak multiple bus operators
  • Result: extreme competition and low level of service
  • User pays inefficiency with inflated fare
  • Few powerful actors win e.g. bus operators
Then cites the first institutional change enacted in both cities - to strengthen bus operators by:
  • Curitiba, 1955-58:
  • ---From 150 to 9 operators by assigning each an exclusive area to operate (monopoly)

  • Bogota, 1998-2000
  • ---68 bus companies consolidated into 4 large operators for TransMilenio with exclusive rights to new routes

    ---large capital investors in some cases own majority stake

He goes on to cite the differences in approach in each city and concludes that effective BRT rollouts require strengthening both the bus operators and the government authority.

What is comforting is the how similar our own metropolis' situation is with the initial institutional frameworks of both Curitiba and Bogota.

All we need now are the visionary mayors.

P.S. -Read the NYT article to catch this emblematic story of Lernier's political smarts:

On Saturday mornings, children gather to paint and draw in the main downtown shopping street of Curitiba, in southern Brazil. More than just a charming tradition, the child's play commemorates a key victory in a hard-fought, ongoing war. Back in 1972, the new mayor of the city, an architect and urban planner named Jaime Lerner, ordered a lightning transformation of six blocks of the street into a pedestrian zone. The change was recommended in a master plan for the city that was approved six years earlier, but fierce objections from the downtown merchants blocked its implementation. Lerner instructed his secretary of public works to institute the change quickly and asked how long it would take. ''He said he needed four months,'' Lerner recalled recently. ''I said, 'Forty-eight hours.' He said, 'You're crazy.' I said, 'Yes, I'm crazy, but do it in 48 hours.' '' The municipal authorities were able to accomplish it in three days, beginning on a Friday night and installing paving, lighting, planters and furniture by the end of the day on Monday. ''Being a very weak mayor, if I start to do it and take too long, everyone could stop it through a juridical demand,'' Lerner went on to explain. ''If they stop the work, it's finished. I had to do it very fast, at least in part. Because we had discussed it a great deal. Sometimes they have to have a demonstration effect.''

The demonstration worked. Within days, impressed by the increase in their business, the once-recalcitrant shop owners were demanding an extension of the traffic-free district. Some diehard motorists, however, sulked. Lerner heard that a group of them were planning to disregard the prohibition and drive their cars into the street on a Saturday morning. So he contrived an unbreachable defense. With the cooperation of the city's teachers and a donation of rolls of newsprint and boxes of paint, on that morning he assembled several hundred children in the street, where they sat and drew pictures. ''It was to say, 'This is being done for children and their parents -- don't even think of putting cars there,' '' he told me. The sputtered-out protest was the last resistance to the pedestrianization of the shopping area, which has since expanded from the original 6 blocks to encompass about 15 today. ''Of course, this was very emblematic,'' Lerner recounted. ''We were trying to say, 'This city is not for cars.' When many mayors at the time were planning for individual cars, we were countervailing.'' He observed that it was emblematic in another way also: ''From that point, they said, 'If he could do this in 72 hours, he can do anything.' It was a good strategy.''


Image Credit: Photo from Urban Planning Research
(Randall Crane)

Quick Links

Notable posts on the metro